Saratoga: A Graveyard for Punters, or Not?

Updated:
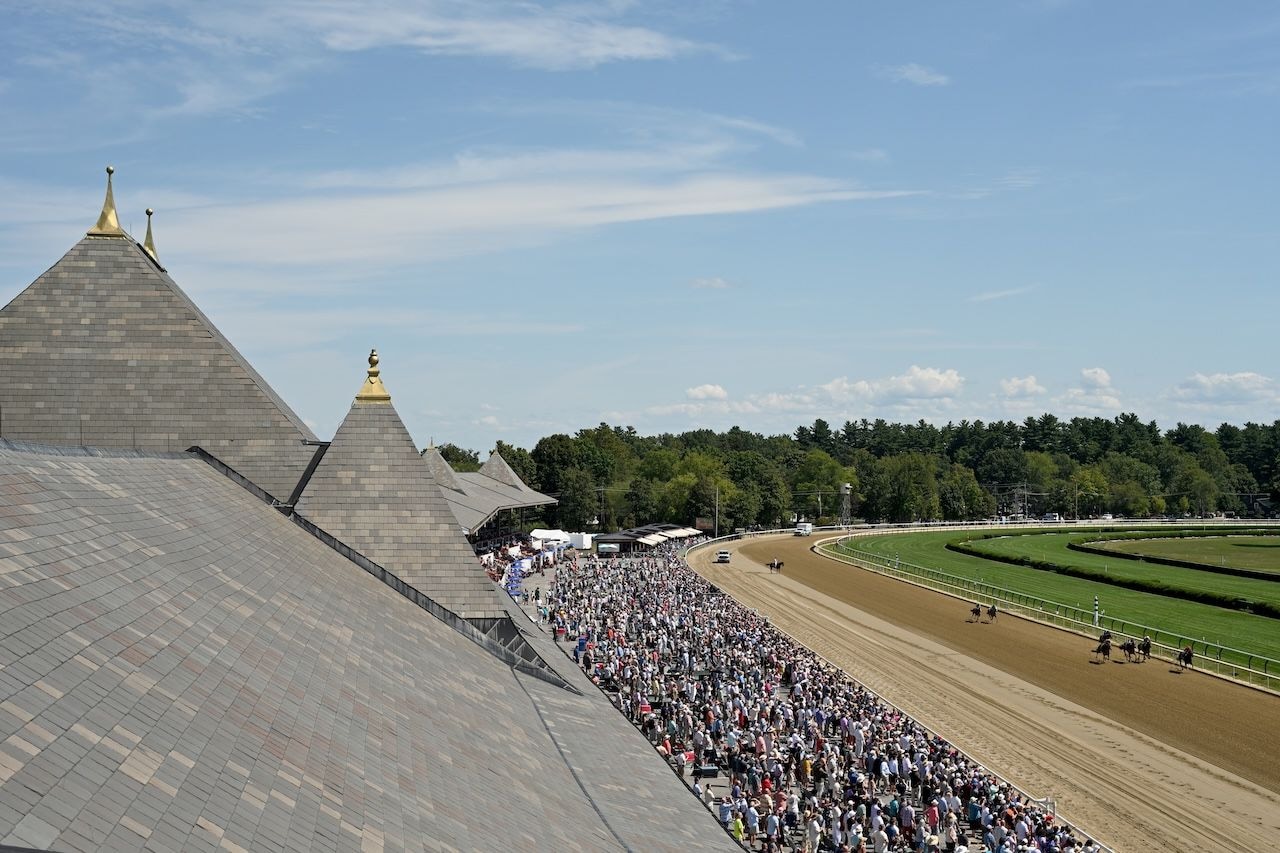
Man o’War in 1919. Gallant Fox in 1930. Secretariat in 1973. American Pharoah in 2015. All were shockingly beaten at Saratoga, earning the course the moniker of the “Graveyard of Champions.”
These defeats were indeed stunning. But do these and a few others mean Saratoga deserves that title? Is there anything inherent about Saratoga that makes it difficult for top horses?
After all, let’s not forget champions were defeated at other venues. Bimelech, Native Dancer, Damascus, and Zenyatta are among those beaten while heavily favored at Churchill Downs. Secretariat, Seattle Slew, Affirmed, and other greats lost at Belmont Park.
Cigar was shockingly beaten at Del Mar, and Seabiscuit and Affirmed were surprisingly beaten at Santa Anita on occasion.
So, is there any way to determine whether Saratoga is any worse when it comes to the demise of champions?
A comparison of starting prices for big race winners
There are a few methods one could use, none of which are foolproof. But one possible way is to compare the average starting odds of winners of Grade 1 races at North America’s most important tracks. These are the races that the said “champions” are most likely to race in. So if Saratoga is particularly prone to surprises in these races, you might expect the average odds of the big race winners to be larger than at other courses.
Statisticians would say this is not scientific by any means – there are a myriad of factors that could make some races more prone to higher winning odds, such as field sizes and unexposed form. Other potential methods could include looking at the percentage of odds-on favorites beaten in Grade 1 races at each course. But this method can still provide some insight.
For this exercise, we’re going to look at feature races from 2000 to 2025 at Saratoga, Churchill Downs, Belmont Park, Santa Anita, Keeneland, Del Mar, and Gulfstream Park. As the highest-profile big-name upsets at Saratoga were on the main track, we’ll stick to those for our analysis.
Because extracting starting odds for winners of all major races is very time-consuming, we’ll focus for now on the races that attract the most attention – the three-year-old races at classic distances, and the open route races for all ages and sexes. In time we’ll look to extend this to all Grade 1 dirt races at these tracks, but for now the focus will be narrower.
We will look at the Breeders’ Cup Classic when it is held at these courses – indeed, that’s the main reason we’re including Keeneland and Del Mar, which otherwise only have one race each that fits the above criteria. The other races we will consider are:
- Belmont Park: Belmont Stakes, Jockey Club Gold Cup, plus the Woodward when held at Belmont.
- Churchill Downs: Stephen Foster Handicap (all Churchill Downs editions at Grade 1 level), Kentucky Derby.
- Del Mar: Pacific Classic.
- Gulfstream Park: Florida Derby, Pegasus World Cup/Donn Handicap.
- Keeneland: Blue Grass Stakes (not including Grade 2 editions 2017-2021).
- Santa Anita: Santa Anita Derby, Santa Anita Handicap, Goodwood Stakes (previously the Awesome Again, only including Grade 1 editions at Santa Anita).
- Saratoga: Whitney Handicap, Travers, plus the Belmont, Woodward, and Jockey Club Gold Cup when held at Saratoga.
(NB: the Woodward Stakes was downgraded to Grade 2 in 2023, but all Grade 2 editions of the Woodward have been held at Aqueduct, which doesn’t form part of this study due to a lack of suitable Grade 1 races and its recent closure).
With these criteria, how do the various tracks fare?
Results: Saratoga not such a graveyard
For this century at least, Saratoga has been far from a graveyard in these big races, for players at least.
Using the listed criteria, there have been 74 contests in these major races at Saratoga this century. The average starting price for the winners was 4.94-1. Only Gulfstream Park, with an average starting price of 4.18-1 over 52 races, has a lower starting price.
The most notable thing about the starting prices of Saratoga big-race winners studied was the lack of longshot winners. There’s nothing approaching a 100-1 Jim Dandy this century; the biggest upset at Saratoga among the races analyzed was 31-1 shot Premium Tap winning the 2006 Woodward.
This figure is partly held back because, in pure starting price terms, even American Pharoah’s Travers defeat wasn’t particularly outrageous; Keen Ice won at odds of 16-1, which seems remarkably short for a horse fifth in the betting given that there were 10 runners and American Pharoah started at odds of 7-20.
In this analysis, Saratoga wasn’t even the toughest track in New York State. The average starting price of our major race winners at Belmont Park was 7.59-1. This, however, was inflated by the Belmont Stakes (average winning odds 12.5-1), which is perhaps not surprising – the 1 1/2-mile journey is unusual for U.S. dirt racing, and the contestants very rarely have any form over that distance.
In addition, the Belmont Stakes during this period had a few horses seeking a Triple Crown that were at short odds and failed. War Emblem was beaten 19 lengths by 70-1 shot Sarava, Funny Cide was third to 2-1 second favorite Empire Maker, Smarty Jones was a length behind 36-1 chance Birdstone, Big Brown was pulled up in a race won by 38-1 shot Da’ Tara, and California Chrome was fourth behind 9-1 fifth favorite Tonalist.
Without the Belmont Stakes included, the average starting price in the 30 other races we considered at Belmont Park was 4.67-1, shorter than Saratoga in this period.
The most difficult track for players in these races was Churchill Downs, where the average winning starting price across the 2000-2025 editions of the Kentucky Derby, the Grade 1 editions of the Stephen Foster Handicap, and five Breeders’ Cup Classics was 15.31-1, much higher than any other track.
This can partly be explained by the large fields that contest the Kentucky Derby, which means favorites start at longer odds; the shortest starting price of any winner in this period was the 2.3-1 odds on Fusaichi Pegasus in 2000 and Nyquist in 2016. The figure was also inflated by long-odds victories by Rich Strike (80-1), Country House (65-1), Mine That Bird (50-1), and Giacomo (50-1). The average starting price of Derby winners 2000-2025 is 17.4-1, and the median is 8.20-1.
But even the Stephen Foster hasn’t been kind to punters – something that’s harder to explain given the smaller fields and more exposed form. The average starting price of winners is 14.45-1 – higher than any race considered apart from the Kentucky Derby – and this is despite victories by odds-on shots Gun Runner, Curlin, and Saint Liam. These have been balanced out by longshot victors Pool Play (36-1 in 2011), Colonial Colony (62-1 in 2004) and Seek Gold (91-1 in 2006). Perhaps the late June slot in the calendar is one where some top horses being aimed at the Breeders’ Cup haven’t reached full racing fitness and could be more prone to defeat. Still, it’s more likely a statistical anomaly that will even itself out over more time.
Of the other tracks we considered, Del Mar and Santa Anita were very similar, while Keeneland, which had the fewest number of races considered, was 6.20-1, a figure inflated by longshot Blue Grass winner Stately Victor (40-1 in 2010).
The charts are interesting if we just look at the average starting prices for winners of these individual races (including only races with at least 15 editions at one track[ES2] ):
Four of the last five races on this chart are three-year-old contests in the first half of the year, held at times when we don’t fully know the pecking order of the three-year-olds. The outliers on this list are clearly the Stephen Foster and the Florida Derby, the only relatively predictable major early three-year-old contests.
For good measure, I’ve added the median odds of winners in this period, in case a few longshot winners have skewed the average winning odds; interestingly, the four bottom races in terms of average winning odds are the same four in the median list, with only the Belmont and Stephen Foster switched around. There is more variation in the races above those, with the Goodwood Stakes having the smallest median winner odds. Its average was impacted by winners Mongolian Groom (25.4-1 in 2019) and Gitano Hernando (18-1 in 2009).
Conclusion
As mentioned above, this isn’t a scientific study. Different results might emerge once we add on results from the other Grade 1 contests on the main track at each venue. But this still provides some data about what we might expect in races contested by the best horses in the land, the ones most remembered as champions.
Perhaps what it reinforces is that the Kentucky Derby and the Belmont Stakes (at least when run at 1 1/2 miles) are the most difficult major races for punters – the former because of field size and the fact most of the contestants haven’t raced against each other, and the latter because of the uncommon distance.
But, at least for these races in the period we are considering, the data suggests Saratoga has not been a graveyard for punters – though those who backed American Pharoah in the 2015 Travers may still beg to differ.
ADVERTISEMENT